The Real-time Report
View your Real-time Report.
Read the Reporting release announcement for a full overview of this feature.
The Reporting view has two tabs: Real-time and Snapshots. This page covers the Real-time tab. For periodic AI-powered Snapshots, see the Snapshots help page.
What is the Report?
The Real-time Report gives you a comprehensive overview of how your OKRs are progressing within the current Cycle. It brings together data across Objectives, Key Results, Teams and team members into a single page, making it easy to spot what needs attention and what's going well.
It is available for all users in your Workspace (transparency is key - everyone can see how things are going and everyone can spot problems and take corrective action early), but is designed to be especially useful for leaders and managers who want to keep a pulse on how things are going across the business.
Support and Celebrate
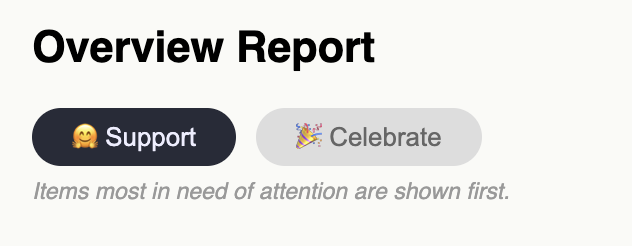
At the top of the Report you can switch between two modes:
Support: items most in need of attention are shown first. Use this to find OKRs that are falling behind or overdue, so you can offer help where it's needed. Read how to spot a stalled OKR in 7 days for a practical framework.
Celebrate: items with the strongest progress are shown first. Use this to recognise great work and share wins with the team.
Overall Progress
The progress graph shows the combined progress of all OKRs over time, plotted against the Cycle timeline. Grey bars show the number of Check-Ins per day, so you can see how active people are.
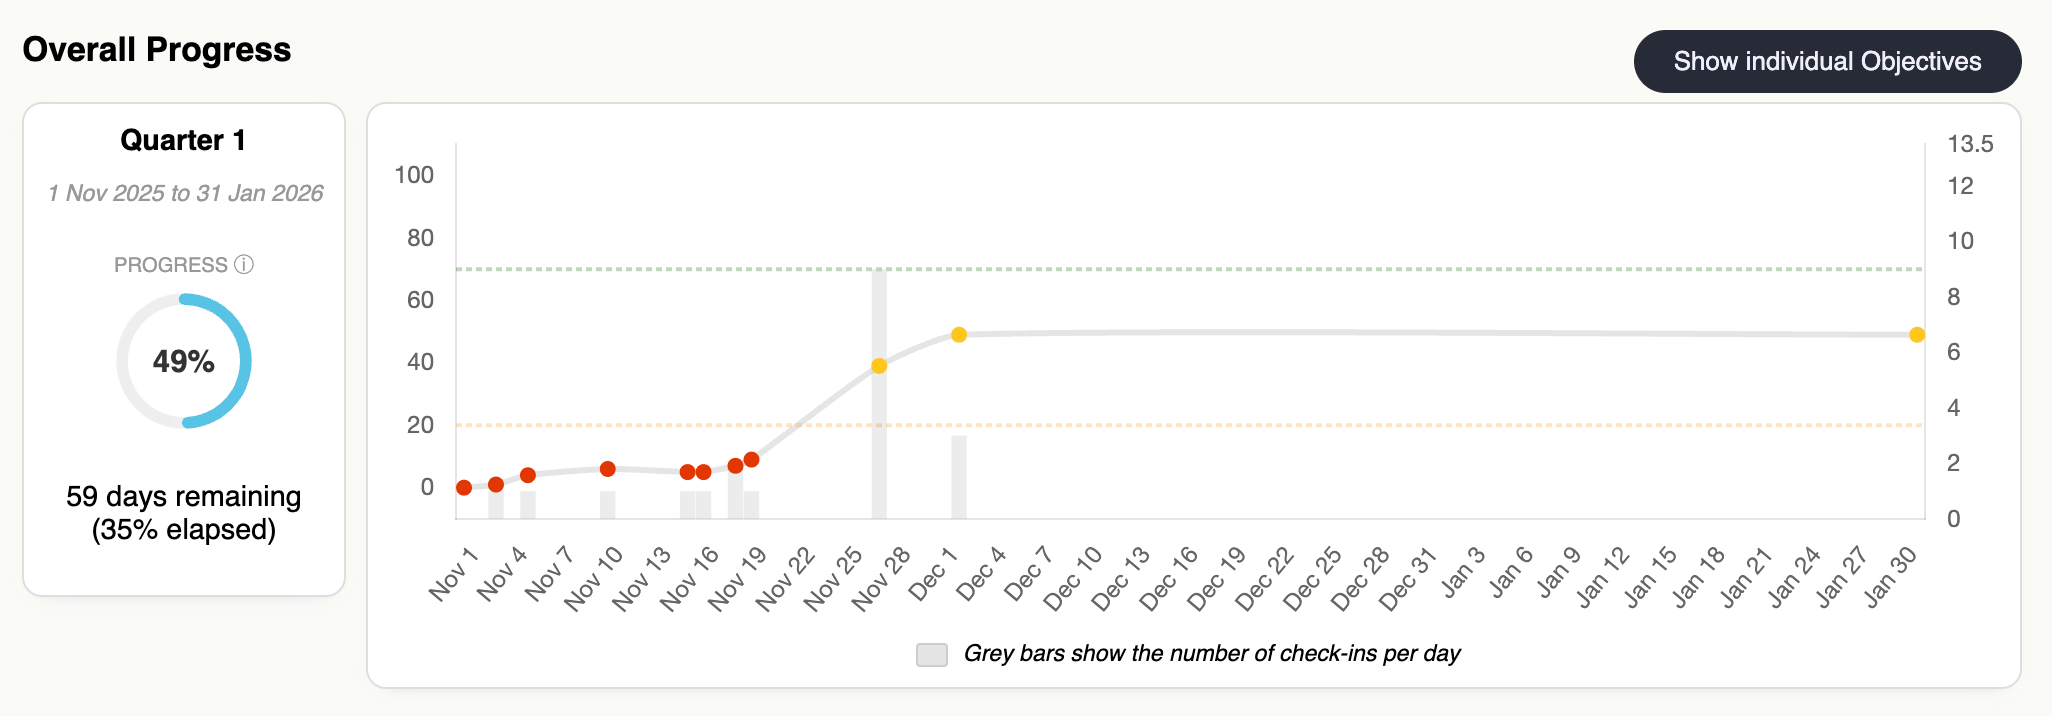
You can toggle the graph to show individual Objective progress lines instead of the combined average, which is helpful for spotting which Objectives are driving or dragging overall performance.
The sidebar shows the current Cycle dates, overall progress percentage and days remaining.
Objectives breakdown
This section shows summary stats for all Objectives in the Cycle:
Complete: the percentage of Objectives that have reached 100% progress.
On track: the percentage of Objectives whose progress is at or above the expected level based on how much of the Cycle has elapsed.
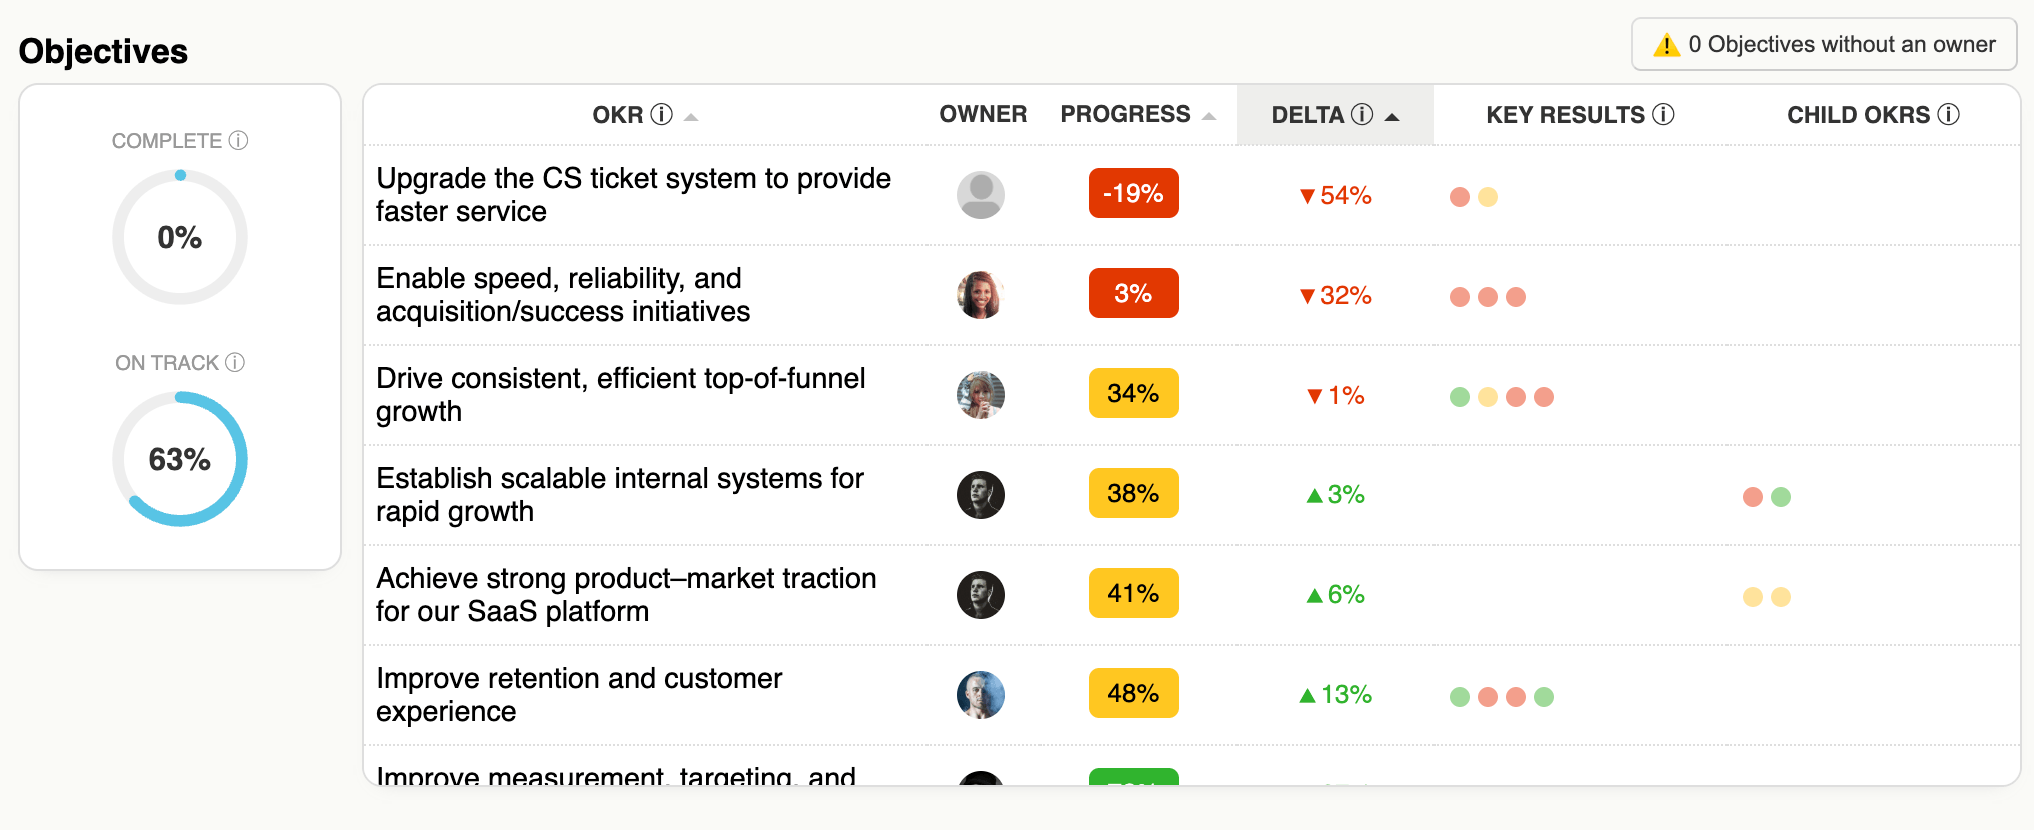
The table lists every Objective sorted by delta (the difference between actual and expected progress). Each row shows the owner, progress bar, delta, colour-coded dots for its Key Results and any contributing child OKRs. Green dots mean >70% progress, amber >20%, and red ≤20%.
These are helpful because it gives a quick visual indication of whether it's the Objective's direct key results which is dragging performance, or the contributing children.
A warning is shown if any Objectives don't have an owner. This is designed to surface best-practice issues so you can address them proactively. Click the warning to toggle the table and highlight the Objectives without owners.
Key Results breakdown
Similar stats are shown for Key Results, with an additional metric:
Up to date: the percentage of Key Results that are not overdue for a Check-In, based on your Workspace's Check-In frequency setting.
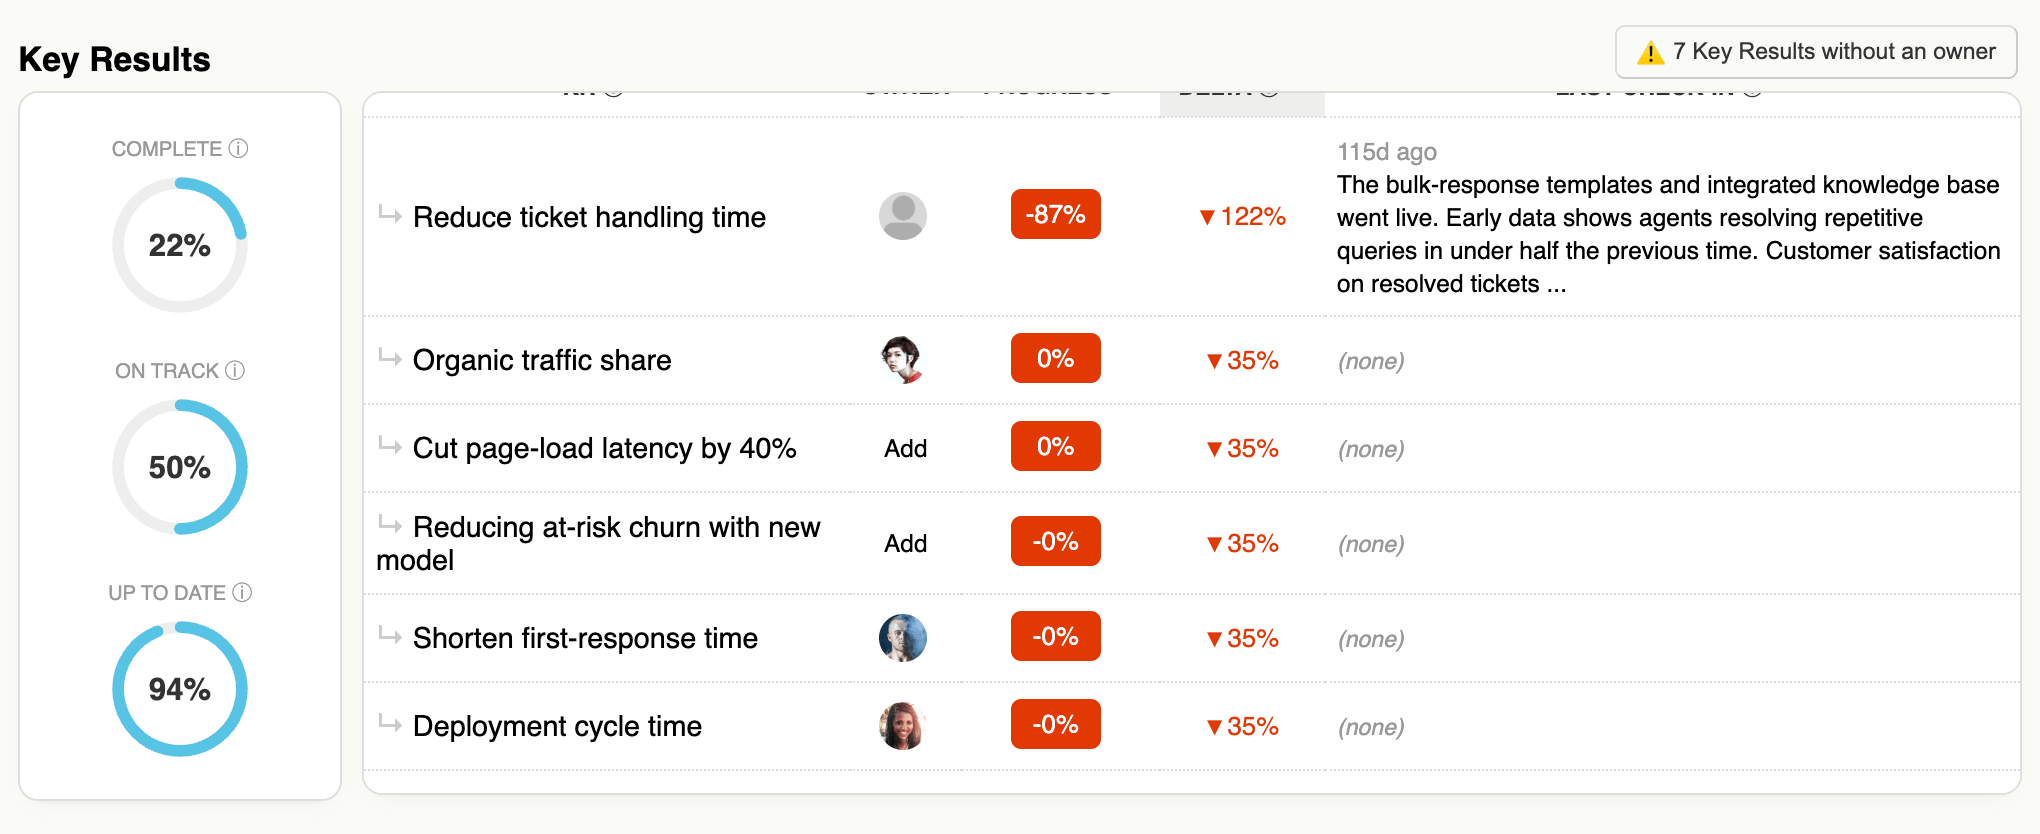
The table lists every Key Result with its progress, delta, and the most recent Check-In comment. Overdue Key Results are flagged with a clock icon showing how many days overdue they are.
If your Key Results are not being updated frequently, then your data is accurate and the report won't be as useful. Use the report to spot which Key Results are overdue and encourage the owners to make their Check-Ins so you have a clear picture of how things are going. For more on why reporting quality matters more than scoring metrics, read why OKR scoring is a vanity metric.
Same as for Objectives, a warning is shown if any Key Results don't have an owner.
Teams breakdown
The Teams table summarises each Team's OKR performance: how many OKRs they have, the percentage that are done, on track and off track, and how many Key Results have overdue Check-Ins.
A warning is shown if any Team has too many OKRs, which can dilute focus. This is based on the best practice of having no more than 3 per Team. If you have teams which are overloaded, they may not be able to focus effectively on their most important objectives.
Team Members breakdown
The Team Members table shows each person's ownership count (how many Objectives and Key Results they own), their total Check-Ins this Cycle, and how many of their Key Results are overdue for a Check-In.
A warning is shown if any member owns too many items, which can be a sign of overload and can lead to that team member not being able to keep up with the required updates or actions.
Warnings
Throughout the Report, toggle buttons highlight potential issues:
Objectives or Key Results without an owner.
Teams with too many OKRs.
Members with too much ownership.
These are designed to surface best-practice issues so you can address them proactively. Having clear ownership and manageable workloads helps ensure that OKRs are effectively tracked and achieved.
Assigning Owners
If an Objective or Key Result doesn't have an owner, you can assign one directly from the Report by clicking "Add" in the Owner column. This saves you from having to go and edit the OKR.