OKR Dashboard view
View your OKR Dashboards.
OKR Dashboard
Our Dashboard view presents a "big screen" view of your OKRs and their current state, useful for putting up on a TV or monitor in your office or at home, or for stakeholder presentations.
It shows different widgets depending on the Key Result type:
-
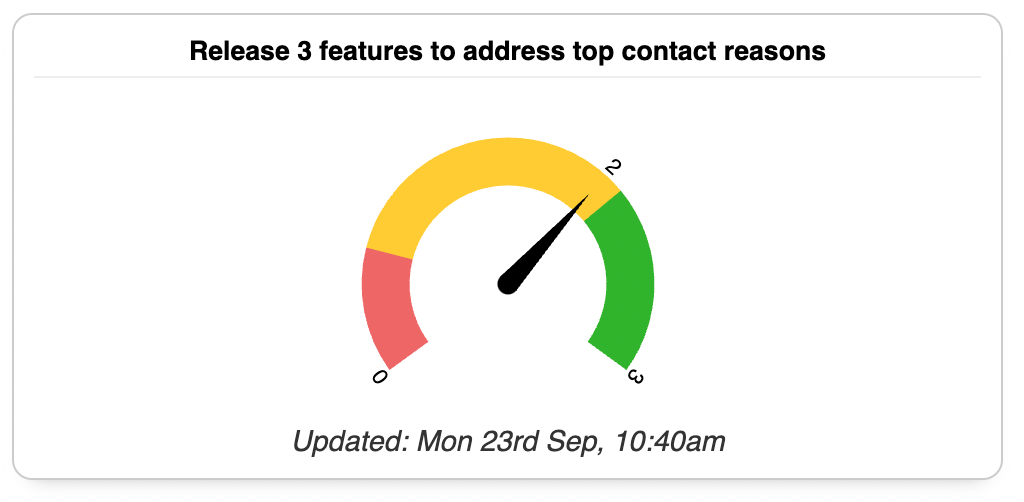
Numeric KRs: show as a simple gauge highlighting the current value against the start and target values. The first 20% is coloured red, and anything above 70% is coloured green since 0.7 is the normal target threshold for KRs.
-
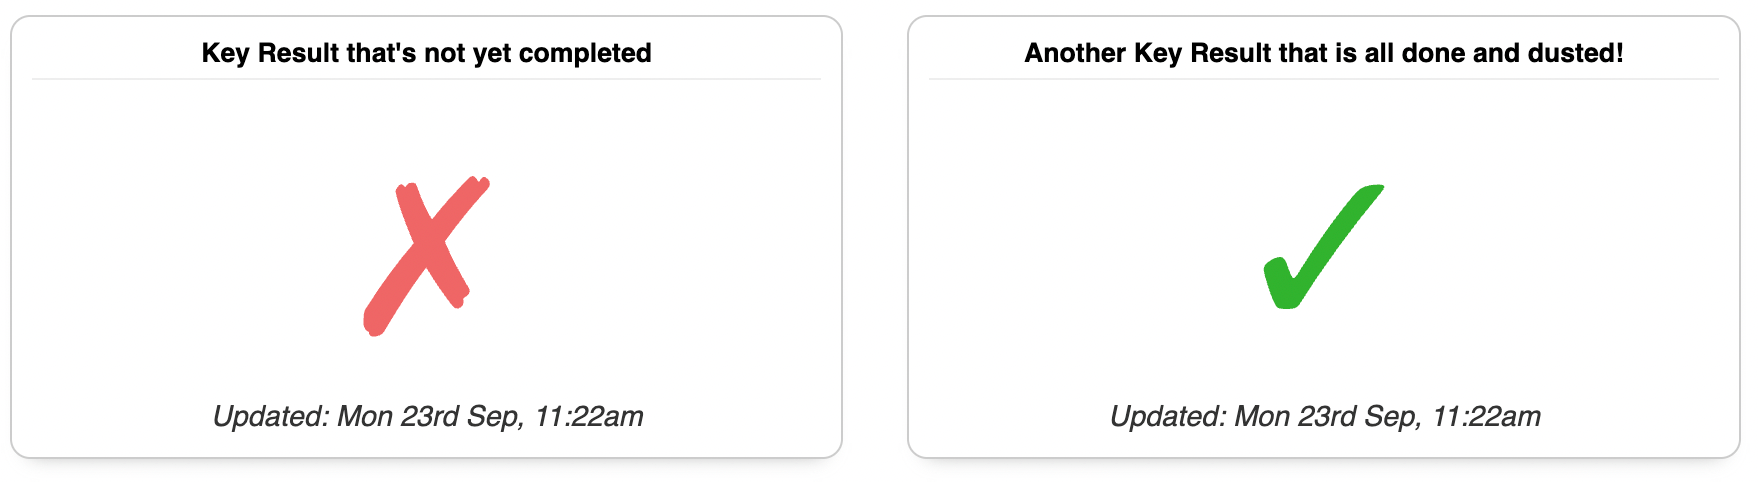
Milestone KRs: milestones are either "done" or "not done" so this widget shows a tick or a cross.
-
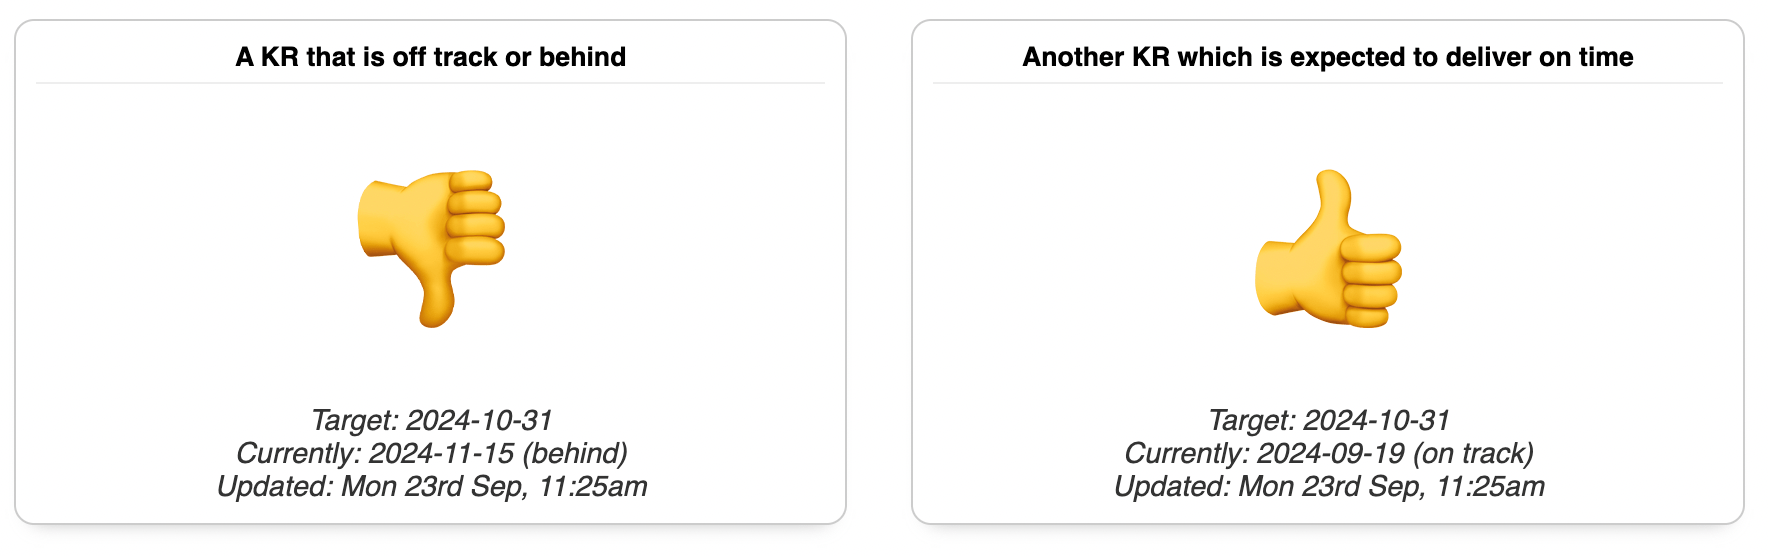
Delivery KRs: shows a thumbs up or down depending on whether the delivery is on track / delivered, or off track / delivered late.
Creating Dashboards
You can create multiple Dashboards to show different groups of OKRs. For example you might have one Dashboard showing all OKRs for a particular Team, and another showing just the OKRs that are owned by a particular person.
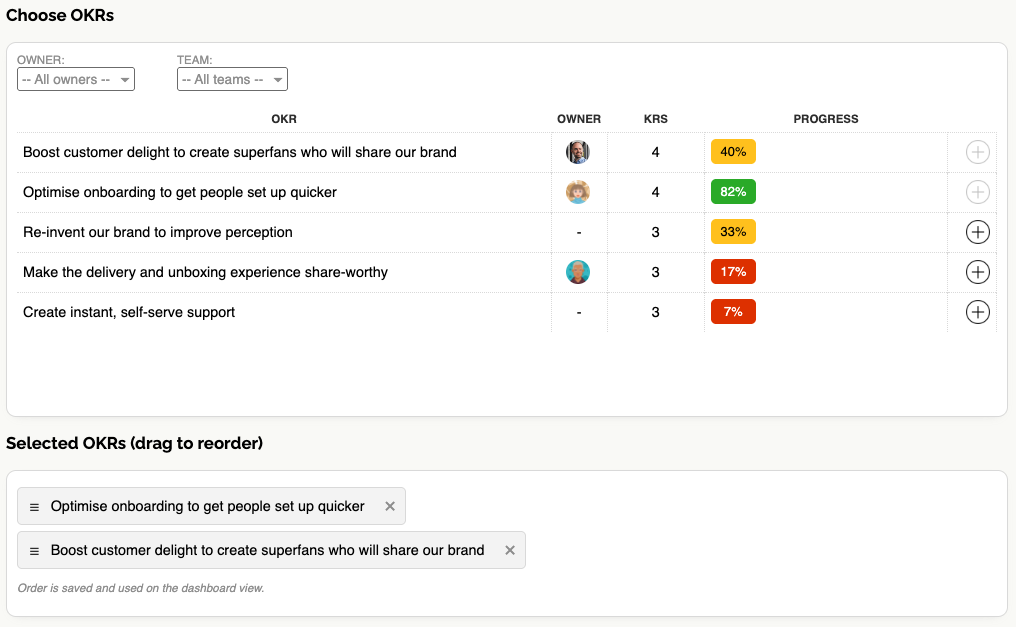
To create a new Dashboard, click the "New Dashboard" button at the top right of the Dashboards page. You can give your Dashboard a name, and add any Objectives from the current Cycle to it. You can add as many Objectives as you like, and they will be displayed in the order you add them.
Once you've created a Dashboard you can edit it to add or remove Objectives, or to change the name. You can also delete a Dashboard if you no longer need it.
Sharing Dashboards
Dashboards are public, but have a randomised URL so they can't be accessed without a special link.
Dashboards can be shared by simply sharing the URL. You can share the URL with anyone, and they will be able to view the Dashboard even if they don't have an account on OKR Dash. This makes it easy to share a Dashboard with stakeholders or colleagues who won't need to log in to see the progress.
Because real-time information is highly valuable, Dashboards will automatically refresh to show the latest progress. The refresh interval is currently set to 10 minutes, but we're planning to make this configurable in the future.
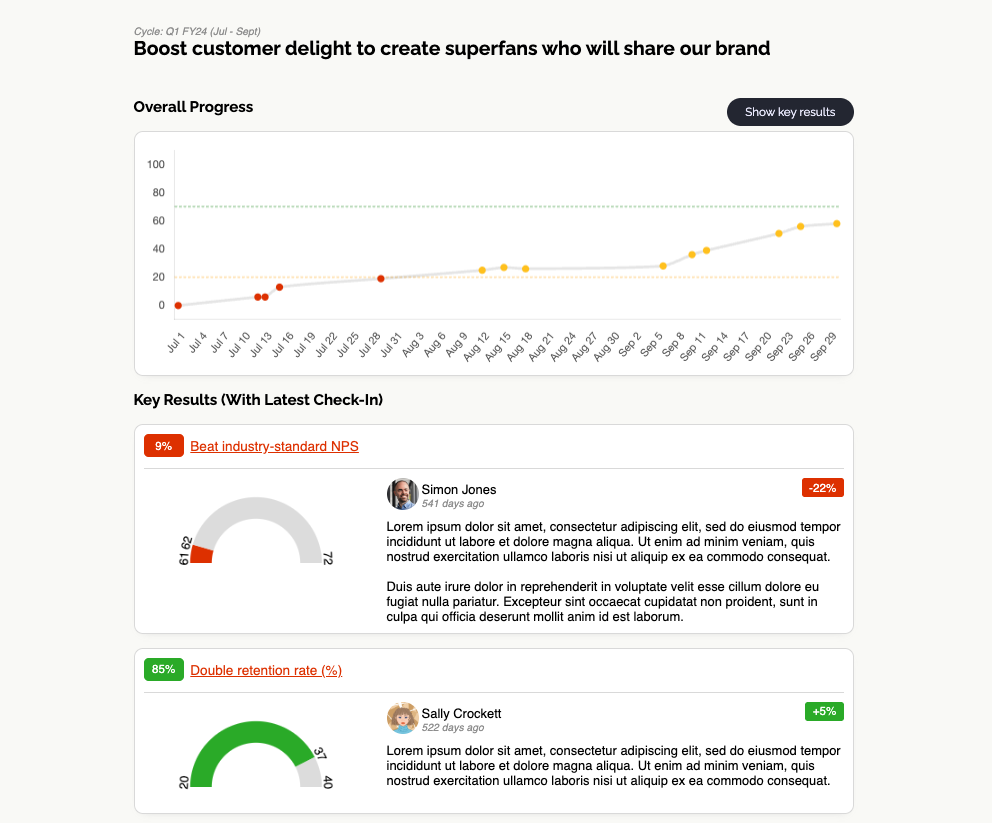
Presentation View for individual OKRs
As well as the Dashboard view, you can also view an Objective in "presentation mode" which can be accessed by clicking the "Presentation View" button in the OKR List table.
This is a summary view of an OKR, showing a graph of the overall progress over time, and the latest check-in for each Key Result. This view is designed for sharing in meetings or presentations, or in your weekly check-in review.
Presentation Views are also public so can be shared with randomised links. Inside any Dashboard, links to Objectives will take the user to the Presentation View. This way stakeholders can easily browse the latest progress without logging in.
For a real-time stream of all updates as they happen, see the Activity Feed.